
Issues in US elections
⇒ Full list of United States essays
Introduction
The United States Congress has long been dominated by the nation’s two dominant political parties. Since the mid 1990s the competition for control has been intense and usually the overall numbers in each of the two houses have been close.
In the section on elections data I have set out a technical description of the electoral system for the US House of Representatives and the US Senate. A more critical analysis of the House electoral system [page under development] is also included. At some point I will draft a similar critical analysis of the system by which the US Senate is elected (it is plainly the most bizarre in the democratic world.)
The election results page has specific election reports on the 2012 and 2014 US House of Representatives and Senate elections.
US House of Representatives elections are conducted under the single-member division plurality system (although three of the 50 states employing two-round runoff variants). As a result, malapportionment and concentration distortion have long been significant problems.
Malapportionment was rampant for a century and a half until a series of Supreme Court decisions in the early 1960s ruled that one of the post-civil-war reconstruction rights amendments to the US constitution (the 14th amendment, adopted in 1868) requires that every person had an entitlement to equal representation in US federal and state legislatures. This was specifically interpreted to mean that legislative electoral division (or in US parlance, ‘district’) boundaries must be drawn so that within the relevant state the population within each district is as nearly equal as possible.
Sad to say, but if the Court’s belief was that the 14th amendment requires equality of influence in election outcomes, equal-population districting does not achieve that goal, because the simple reality of all systems based on single-member divisions is that influence is widely divergent between electoral divisions which are ‘safe’ and those which are ‘marginal’ (or in US parlance, ‘contestable’). Population equality of districting does not remedy the problem of divergent real influence.
Moreover the equalisation required by the US constitutional decisions only applies within each state, not between all the divisions across the nation, and as a result substantial population variations are still visible across the nation for House of Representatives districts.
Then there is the problem of concentration distortion, whereby an uneven demographic distribution of the supporters of different political parties can lead to aggregate results for numerous seats which do not match the general result which might be expected from the region as a whole. Concentration distortion is another natural phenomenon in single-member division systems. It is hard to minimise and is impossible to prevent.
Finally, there is the practice of gerrymandering, which is the deliberate drawing of division boundaries specifically to increase concentration distortion effects for political advantage. Gerrymandering is rife in US electoral systems, because boundaries in many states are adopted by state legislation and are drawn up by partisan state legislators often without a hint of shame.
All US House of Representatives state-by-state seat allocations and division boundaries are reviewed every 10 years following the decennial census, so the balance of advantage in partisan control of state legislatures in the ‘-12’ years – the most recent being 2012 – becomes a key aspect of the US congressional electoral system. In addition, modern data collection and computation has made gerrymandering increasingly easy. In 2012 the Republican Party held the most influence over setting congressional division boundaries, and used it to ruthless effect. (They were aided by the Illinois Democratic Party, which bizarrely gerrymandered itself, gifting the Republicans an estimated 3 seats in the 2012 elections).
Partisan control of the 2012 redistricting process for congressional boundaries
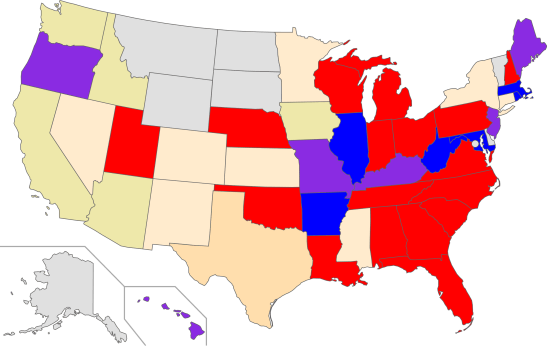
Republicans (red) controlled boundary-setting in 17 states, while Democrats (blue) controlled 6. Joint partisan control, requiring traded gerrymandering outcomes, applied in 6 states (purple).
14 states had less partisan results, being controlled by independent commissions (pale yellow) or by the courts (pale orange). The Republican party had also initially controlled the Texas redistricting, but their initial plan was so egregious that it led to litigation and a court-ordered compromise.
The 7 single-seat states (grey) obviously have no districting at all.
Analysis of the 2012 redistricting process [page removed – under development – blog post here] indicates that – after taking into account the problem of data gaps caused by uncontested seats – the balance of gerrymandering in 2012 won at least 22 extra seats for the Republicans. This made a very real political difference, turning what might hypothetically have been a very narrow Democrat majority in the House into a noticeable Republican majority.
Building on those conclusions, I have also included an analysis of how the US House of Representatives might have been composed at the 2012 election [page removed for revision] had a system without malapportionment and gerrymandering been used. This requires some assumptions about votes that would have been cast in the seats which went uncontested, as well as assumptions about using some form of regional electoral system (I have used STV, but any of the party-based seat allocation formula would reach similar results).
In the 2014 elections the Republicans picked up a few further seats, cementing their control. However 2014 was not merely a low-turnout mid-term election, it was – at a miserable 35% – the lowest turnout election of the House since the 19th century, with the exception of the war election of 1942. This seems to have been largely due to a failure of 2012 Democratic voters to participate. This result further complicates any meaningful analysis of hypothetical ‘fair’ election results, or the specific impact of tot 2012 gerrymandering on the 2014 election results.
Finally, it’s worth keeping an eye on a current dispute over whether the equality between divisions should be based on the total population or on some subset of population, such as vote-eligible citizens, or actual registered voters.
The litigation – Evenwel v Abbott – is being brought by the Project on Fair Representation, a conservative lobby group set up to mount the action. The US Supreme Court heard argument in December 2015, and the case is due for decision in early-mid 2016. Illustrative media reports include those in Slate, The Nation, New York Times and Washington Post, and there’s useful commentary at the Brennan Centre for Justice.
If adopted, the narrower eligible voter definition would require fresh redistricting that would shift (probably modest) numbers of congressional representatives away from regions with above-average proportions of people below age 18 and non-citizen immigrant populations.
Using the even narrower registered-voter definition would further disadvantage areas where registration laws and practices operate to suppress registration by african-american, hispanic and other minorities, as well as above-average populations of voters whose entitlement to vote is suppressed based on past or present criminal convictions.
All these tendencies are generally understood to favour Republican Party potential to win additional seats, and the litigation is therefore highly partisan.
However in order to agree with the litigant, the Supreme Court would need to open up a complex disharmony between other aspects of the constitutional allocation of representation between the states, which is clearly based on pure population.
In addition, submissions to the Court by technical experts including former Census Bureau officials have pointed out that data to reliably support estimates of vote-eligible population are simply not captured in current US census practices. Data on specific voter registration is also variable in quality and timeliness, as well as being based on different and often partisan state-by-state official practices.
The Court’s decision can be expected any time up to June 2016, but any decision forcing a fresh review of state district boundaries that late in the year would throw preparations for the November 2016 elections into disarray.
Malcolm Baalman
2 January 2016
