
Gerrymandering still rife in US congressional districts
As US voters go to the polls to choose 435 House of Representatives members, the Republican party has an artificial advantage of more than 20 seats, built into the contest by gerrymandered district boundaries.
Gerrymandering – the are of manipulating boundaries in electoral divisions to help a political party win more seats in a region without winning more votes – is rife across the United States.
While most western democracies have handed the task of electoral boundary-setting to independent, non-partisan authorities, in the US a majority of the 50 states confer the task of fixing boundaries on state politicians. They get to set the district boundaries for their own election as well as those for federal Congress members.
Partisan boundary-setting goes on across the United States without embarrassment. Both major parties have shameful past track records.
The boundaries are normally redrawn in the year or two after each national census, which occurs every ten years in years ending in “0”, the most recent obviously being 2010. Federal law and court decisions actually requires refreshing of the boundaries every decade to keep track of population movements.
The rise of high-detail electronic data resources in the past few decades has turned redistricting into a very sophisticated art.
The 2011-12 round of redistricting was heavily influenced by a wave of state political victories by the Republican party in the 2010 elections. As a result, the Republican party controlled boundary setting in 18 states, with the Democrats controlling just six.
Six States had divided electoral results, requiring the parties to compromise.
In 13 states, election laws have been modernised to transfer the task of boundary-setting to non-partisan authorities.
Partisan control of the 2011-12 redistricting process for congressional boundaries

Republicans controlled congressional boundary-setting in 17 states (red), while Democrats (blue) controlled it in six. Joint partisan control, still potentially requiring traded gerrymandering outcomes, applied in six states (purple).
The Republican party had also started in control of the Texas redistricting, but their initial plan was so egregious that it led to litigation and a court-ordered compromise.
14 states had non-partisan systems, being controlled by independent commissions (pale green) or by the courts (beige).
The seven single-seat states (grey) obviously need no districting.
The American judiciary has entered into the process to some extent, but with reluctance. Many judges clearly feel that the judiciary should not be drawn into constant partisan conflicts. It is often pointed out that no single judicial ‘standard’ for deciding partisan redisctricing disputes has yet been found.
In one notable Supreme Court judgement in 2004 – Vieth v Jubelirer, narrowly decided by a 5-4 vote – the majority held that partisanship was not constitutionally illegitimate in US political boundary-setting. Recently deceased Justice Antonin Scalia wrote the lead judgement, concluding that the tradition of partisan gerrymandering was simply beyond judicial control.
On the other hand, Justice Kennedy, one of the majority members, indicated in his Veith opinion that the First Amendment of the US Constitution – concerned with freedom of speech and expression – might give grounds for a legal challenge. Subsequent developments of his proposition probably require challengers to show that a state legislature had deliberately retaliated against specific citizens on the basis of their political views when drawing new boundary lined between districts.
Earlier civil rights-era Supreme Court rulings had however made clear that boundary-setting may not include racial discrimination. Since African-Americans are strongly associated with voting for the Democrat party, gerrymanderers often use racial demographic data to determine their boundaries.
In the past two years courts in Texas, North Carolina, Virginia and Florida have struck down Republican-drawn boundary maps for egregious gerrymandering that included a racially-based element. Significant litigation on redistricting issues has occurred – or is still ongoing – in at least seven states.
The clearest case study: North Carolina
The North Carolina arrangements produced by the last redistricting exercise were astonishingly contrived. The state legislature’s original 2012 map of electoral district boundaries (below) – which has now been used at both the 2012 and 2014 elections – saw several districts with outlines contorted beyond all logic.
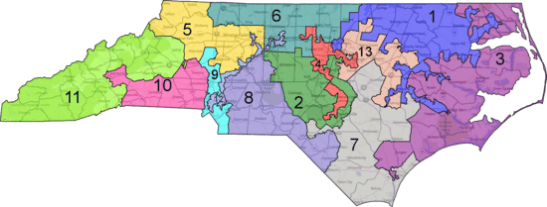
The 13 congressional districts for North Carolina, determined by the state legislature in 2012 (image: Stephen Wolf/Daily Kos)
Districts 1, 2, 3, 4, 7, 9, 12 and 13 all show absurdly ‘wriggly’ boundaries, all contrived to place concentrations of both Democratic and Republican voters into selected districts so that the Republican party could win more of them.
Districts 1, 4 and 13 display the bizarre shapes of salamanders with dreadful birth defects. District 12 – almost invisible on the map above between districts 8 and 9, has the shape of a narrow river valley – not a real river, but simply an artificial attempt to link multiple townships.
The purpose of gerrymandering is, of course, for a party to win more of the available seats. The North Carolina gerrymander has certainly achieved its intended result.
In the November 2012 elections North Carolina voter support in House contests narrowly favoured the candidates of the Democratic party – 2.22 million votes (51%) to 2.14 million votes (49%) for Republicans. With a statewide result that close, a natural result would be for the seats to split 7/6. It’s reasonably possible that seven seat wins might even have gone to the 49% party just because of demographic patterns without causing much surprise.
But what happened in 2012 was that the Republicans leveraged their 49% vote into wins in nine out of the thirteen seats, leaving the Democrats only four.
The gerrymandered boundaries had massively concentrated the Democratic voters into just three districts – districts 1, 4 and the riverine district 12 – where Democratic majorities of 75% to 80% were recorded.
The other ten seats all had Republican support much more evenly spread, with Republican votes running from just below 50% to 63%. The Democrats narrowly clung on to one of these seats – district 7, which was won by just 650 votes, 50.1% to 49.9%.
This scenario is a perfect illustration of successful gerrymandering. By contriving to ‘pack’ large numbers of the opponent’s voters into a small number of seats which are conceded entirely, all the remaining seats, even though nominally less safe, can be won to create the artificial parliamentary majority.
Two years later, in the mid-term 2014 elections, voter turnout was sharply lower. (This is true of all mid-term elections in the US, although in 2014 the national result was the lowest since universal suffrage was achieved, at just 35% – one of the lowest turnouts ever recorded in a developed democracy.)
The Democrat vote in 2014 North Carolina House contests dropped from 2.22 million to 1.23 million. The Republican vote dropped less, from 2.14 million to 1.56 million. The Republican party now had a majority share (55%) of the lowered vote. They still sacrificed districts 1, 4 and 12 to their opponents, but now picked up the marginal district 7 as well, giving them 10 of the state’s 13 federal seats for the past two year term.
Alas for the Republicans, documents subsequently emerged showing the calculations and paperwork by which the boundary-drafters had gone about their work. It emerged that race has, impermissibly, been used as one of the proxies for the Democrat vote during number crunching.
The opponents of the Gerrymander therefore found their opportunity for a legal challenge (Harris v McCrory), which finally succeeded in a federal court in February 2016. The judgement ordered the state legislature to urgently issue a new set of boundaries – to the considerable disruption of the election year, where nominations for primary elections were already underway under the original boundaries.
The new and less plainly ridiculous boundaries were still drawn up by the Republican-controlled legislature, but this time they managed not to be demonstrably based on racial demographics.
At about the same time, similar litigation (Wittman v Personhuballah) concerning the redistricting of the state of Virginia – which the lower courts had also ordered to be redone – was being considered in the US Supreme Court. In May the equally divided 8-member high court sidestepped the issue by ruling that the plaintiffs did not have standing to bring the challenge.
The cases have at least put some limits in how states proceed with redistricting exercises.
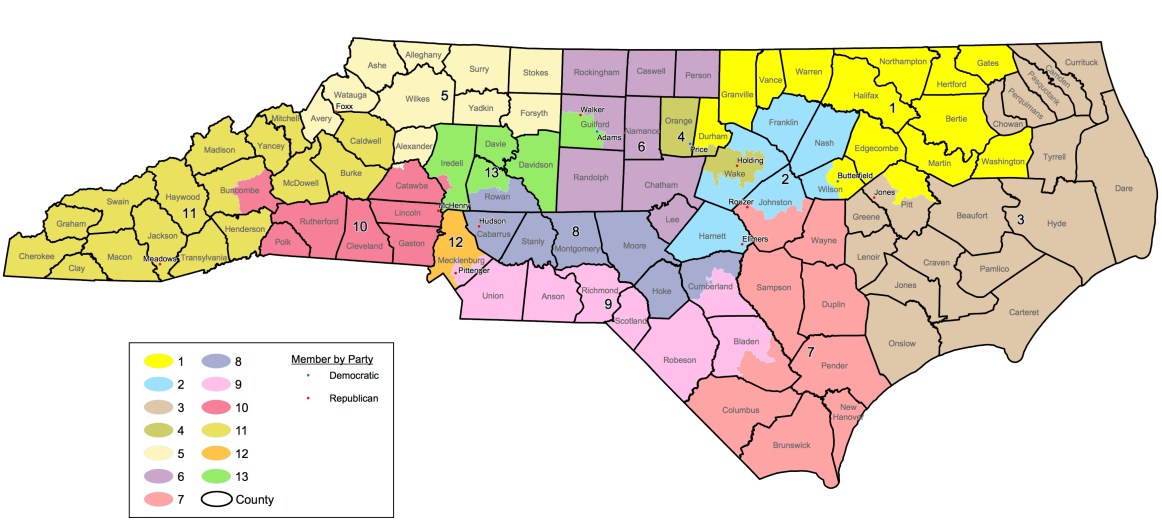
The new boundaries for North Carolina’s US House of Representatives districts for use in the 2016 elections are more compact, but some districts still feature moderately unnecessary shapes (image: North Carolina General Assembly)
With the fuller 2016 turnout expected in a presidential election year – indeed, possibly a bumper turnout with the presidential, Senate and Governor races in the state all regarded as close contests – the votes cast for the two parties in the House districts this week should again be much closer. Do the Democrats have a chance to pick up seats under the new state electoral boundaries?
No.
Three of the most prominent analysts rating the coming elections are Larry Sabato (Crystal Ball), Charlie Cook (Cook Political Report) and Real Clear Politics. None of these three agencies rate any of North Carolina’s 13 new districts as close contests in this election. They are all predicting the Republicans to have 10 safe districts, with 3 for the Democrats.
In short, the new boundary map for North Carolina has created 13 safe districts in such a way that experts agree there is no foreseeable vote result in the state that will do otherwise than elect the specified ten Republicans and three Democrats candidates – even if the majority of the state’s voters support Democratic candidates.
The impact across of the nation
The impact of gerrymandering can be difficult to pin down precisely. It is a phenomenon arising between multiple districts, and can’t be precisely detected by scrutinising just one district at a time. A single seat cannot strictly be said to be the one that is gerrymandered; it can only be said only that among several results, gerrymandering occurred as a whole. The precise location of, or boundary which caused, the malpractice can be almost impossible to identify.
Election results are also, of course, the products of many factors, including changing demographics, national or state waves off support for one party of the other, anomalous local swings and of course better or worse individual candidates.
But even with such caveats, the outcomes of the national 2011-12 round of redistricting outcomes are transparent enough that aggregate estimates of the impact in each state can be attempted, and they can even be broken down by the groups of states that were officially redistricted under each form of partisan or independent control.
On the whole, at the 2012 elections, in the five states where boundaries were drawn by independent commissions, a vote-proportional seat result* would have seen around 45 Democrats and 33 Republicans elected (this group includes California, a state where Democrats do well.) The actual election result was 46/32, just one seat different.
In nine states where courts oversaw the process of redistricting (including after vigorous litigation Texas, but prior to the court revisions to districting in Virginia and North Carolina that were not decided until this year) a putative result of 50/48 could be expected, and that was exactly what the elections generated.
The six states under Democratic party control should have yielded a 24/20 result, but saw a two-seat shift to 26/18. Pro-Democratic distortions in Massachusetts, Rhode Island and Maryland were offset by – amazingly – a three-seat gain for the Republicans in Illinois, where the local Democratic party had actually gerrymandered itself (making several seats held by incumbents ultra-safe, a great personal result for the sitting members, but contributing to the national result which put them into opposition in Congress).
But in the 17 states controlled by Republican legislators, the outcome was dramatically different. These states in total should (proportional to votes cast) have sent a putative 82 Democrats and 91 Republicans to the House. Instead, they sent just 48 Democrats and 125 Republicans.
Gerrymandering generates its best results in states where the two parties are closer together in voter support. This is simply the situation where deliberately distorted boundaries have the most effect. Safe states tend to produce lopsided majorities naturally, even with innocently-drawn boundaries (which is a serious problem for democratic representation, but it is not always deliberately contrived).
So another way to look at the impact of gerrymandering is to group all the states which in 2012 had net partisan voter support results inside the 55%:45% range. This included 17 states, with a total of 172 seats. Based on votes cast, these states should nominally have elected around 87 Democratic winners and 85 Republicans. In actual fact, the result was 65 Democrats and 107 Republicans.
All up, leaving aside the ‘safe’ states where result distortions can’t simply be explained by gerrymanders, and also taking into account Texas (which was indisputably gerrymandered as found by the courts) and Illinois (which was somehow reverse-gerrymandered by the Democratic party), gerrymandering can be said to have led to a net effect of at least 22 and up to 28 extra seats won for the Republicans at the 2012 elections. Around seven additional Republican wins may be attributed to Florida alone.

Gerrymander impacts at the 2012 elections in states with voter partisanship within 45%-55% range, plus Texas and Illinois; colours show the party advantaged (blue for Democratic party, red for Republican party, as usual); darker shading indicates more seats were gained due to gerrymandering
In 2012 this made a real political difference. In that year Democrat House candidates won a total of 59.6 million votes, while Republicans had 58.3 million. Yet Republicans won 234 seats to the Democrats 201.
There is a strong case for concluding that the 2012 gerrymanders turned what might hypothetically have been a very narrow Democrat majority in the House in that election – perhaps as close as a single seat majority – into the 34-seat Republican majority that settled into office.
Two years later at the elections of 2014 the Republicans had a better year, winning 39.8 million votes in House contests to the Democrats 35.3 million. That was enough to win the Republicans their current large 247-to-188 seat majority; they were now entitled to a majority, but the result was still disproportional.
And the whole effect will still be in force next Tuesday, when Americans elect the House for the 2017-18 term.
Court outcomes since 2014 have ordered new maps to be drawn for the 2016 elections in three states – North Carolina (discussed above), Virginia and Florida. It remains to be seen how these new boundaries will affect election results this week.
Can gerrymandering be overcome?
Gerrymandering can be overcome by a big enough vote. And when gerrymandering is overcome, it can collapse dramatically.
Gerrymandering relies on heavily concentrating (or ‘packing’) voters who support a party’s opponents into a minority of districts, sacrificing those seats to large opposing majorities in return for the benefiting party achieving closer wins in a larger number of other seats.
Gerrymandering will serve well in close elections. An opponent that wins up to around 54% of the vote (in a fairly uniform two-party scenario such as exists in the United States) can be defeated by enough careful boundary-drawing.
Gerrymandering forms a steep beach, hard for the opposing tide to overcome. But if the tide does manage to rise high enough, the collapse of the strategy can come quickly.
The gerrymanderer will tend to hold many seats by modest margins – wins of 51% to (say) 57%. When the tide comes up high enough, it can flood quickly over a large number of those modest margins.
By organising gerrymandering, the Republicans in many US states have sacrificed the option of holding many of their seats with ultra-safe margins (as the Illinois Democratc seem to have been tempted into) for the bigger ultimate congressional gain of a greater number of narrow seat wins.
In short, if the US Democratic party could reach above around 54% of the vote in the coming elections, they could suddenly find their results surging across the flat sand into a large number of seat wins.
Most pundits don’t expect that to happen. Polls indicate a narrow Democrat national vote majority, and a gain of perhaps 8-10 seats, but not the 30 gains they need, and certainly not more. The beach is steep.
That leaves a problem of a different, more politically visceral kind. If the Democrats do win a majority of the national House of Representatives votes, but only a minority of the seats, and the Republicans use an ill-gotten control of the House to obstruct an expected Clinton administration, there will be one more serious cause for political resentment to factor into the already very troubled post-election climate America is facing.
* There is a technical problem here in that at every election several very safe House seats go uncontested, meaning that some ‘vote’ is missing from the raw election result official totals. The proportional vote shares discussed here make use of estimates to try to correct for this issue.
