UK Election 2017 – Polling and predictions
Final polls before Thursday’s British general election are proving surprisingly diverse, with estimates of the gap between the governing Conservatives and the Labour party across England and Wales varying from as close as 1% to as much as 12%.
There is general agreement amongst pollsters that the Liberal Democrat party will poll around 6-8%, and that the UK Independence Party (UKIP), having achieved its historical mission in the past few years, is fading away to around 4% support.
Polling in Scotland is a bit clearer, placing the Scottish National Party on somewhere around 43%, with the Conservatives rising to near 30% and Labour on around 25%. Such a lead, with two opponents placed roughly equal, will greatly assist the SNP in winning most of Scotland’s seats, as they did in the 2015 election.
The Liberal Democrats’ support in Scotland is concentrated in a few seats making country-wide polling less relevant for that party.
What little polling has emerged from Northern Ireland suggests no great changes among support for the party’s five special regional parties, which faced a local Assembly election only a matter of weeks ago.
The Conservatives started the race in late April with leads estimated at 20%, but have seen a historic fall in support.
Britain’s most eminent psephologist, Sir David Butler, has said the actual shifts in polled support during the campaign – a shift of 10% to 15% from Conservative to Labour – are the largest he has seen since 1951.
But all pollsters still measure the Conservatives to be ahead, and all seat predictors see a significant Tory majority on Thursday night.

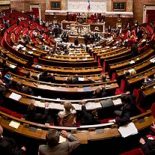
The dramatic closure of the poll gap during the 2017 UK election campaign. (Image: Crosstab)
The extraordinarily diverse national polling estimates (which are actually the England+Wales estimates) emerge from an industry undergoing a lot of experimentation in its statistical methods.
The polling industry suffered embarrassing failures to predict the results of the 2015 elections and the 2016 Brexit referendum.
Apart from all the usual polling challenges in reaching enough interviewees to make good sample sizes, and then re-weighting raw results to match demographic categories, the industry is diversifying in relation to how it estimates likelyhoods of voters turning out to vote.
As in the US, British pollsters distinguish between ‘all respondents’ and ‘likely voters’. They ask interview subjects whether they intend to vote, but then re-weight the results again to apply their own estimates of whether such responses will prove true or not.
Finally, there is the problem of the young, and the likelihood of them voting.
Britain’s population displays a striking correlation between age and partisan support. The young strongly prefer Labour and other left-of-centre parties, while older voters heavily back the Conservative Party.
Middle and older age groups turnout to vote strongly, but the young less so. The 18-24 age group recorded only a 43% turnout at the last election in 2015.
The degree of non-attendance by young voters can therefore shift both polling measures as well as actual election results. So estimation for youth turnout rates has become crucial to effective pre-election polling.
But young voters are not evenly spread geographically. Some commentators argue that they are relatively concentrated in urban constituencies and also those with universities, which are already generally Labour-leaning.
On this analysis higher overall youth voting will simply increase Labour vote leads in seats they already hold safely.
All these factors have led to the historic degree of disagreement between the pollsters.
Key poll tracking results and commentary:
BBC overview and final update
YouGov’s analysis of the debate over methods
Australian poll tracker William Bowe
US political blogger G Elliott Morris’ Crosstab site
Seat predictions
More important still is the complex art of translating poll results into predictions of seat wins.
Britain is far from geographically uniform in the partisan contests that are taking place in the 650 single-member constituencies.
Only around 500 constituencies will see a ‘standard’ Conservative-vs-Labour contest, on which normal polling can be mapped to attempt to predict outcomes.
59 seats make up the entirely separate Scottish political dynamic, and a further 9 out of 40 Welsh seats resemble Scotland in being contests where the Welsh nationalist Plaid Cymru party wins or comes second.
The 18 Northern Irish seats are a completely separate affair again.
Another 50 or so seats involve contests between the Conservatives and the Liberal Democrats, with Labour certain to place third.
Around 16 seats have the opposite situation, with the Conservatives placing third and the contest being between Labour and the Liberal Democrats.
But even in the 500 ‘standard’ contests, the majority are safe seats for either Labour or the Conservatives. Millions of votes, including large components of the parties’ national poll results, are locked up in these 400 or more seats.
While pundits differ on exactly which seats they regard as marginal contests, the number worth watching on election night is probably at most 80.
If either of the two major parties has a better share of its polled voter support in these close contests, they will have a crucial advantage.
In the 2015 election, around 85% of the Conservative vote was either ‘locked up’ in safe Tory seats, or unused in safe Labour ones.
The corresponding figure for Labour was around 82%.
But in 2015 the Conservatives has a 6% overall vote lead over Labour, giving it enough votes to win more of the marginals. That result let them eke out a grand total of 331 House of Commons seats and a fairly thin majority of 12 seats over all other parties combined.
So if the Conservative vote lead over Labour ends up at less than 6% tomorrow, will that mean more Labour marginal seat wins? It’s impossible to say, because there is no published detailed seat-by-seat data (although there is any amount of lesser quality local polling and anecdotal ‘the-mood-feels-good’ commentary circulating about.)
Several commentators are venturing seat predictions, by various methodologies of combining recent overall polling results with past regional vote shares, estimated age profiles and other data.
Aligned with the polling estimates, all the seat predictors are forecasting a Conservative majority.
Key seat predictors:
Most predictions can be simplified to how many House of Commons seats the Conservative Party will win 226 is a majority. They previously held 331.
Academic poll and election forecaster Chris Hanretty at ElectionForecast is calling the result at 371 Conservative seats.
Independent statistical consultant Nigel Marriott is calling 375 Conservative seats. (Marriott also provides very detailed explanations of the polling industry’s methods and divergent results.)
The Economist magazine has a useful overview, again citing Chris Hanretty
A Washington Post model based on citizen forecasting is calling it at 361 Conservative seats.
The BritainElects ‘nowcast’ – based on what would have happened a few days ago – is calling 353 Conservative seats.
Even YouGov – for many days the lone predictor of close poll results and a hung parliament – ends the campaign predicting an unstated ‘increased majority’ for the Conservatives. (Update: apparently this last point is wrong – YouGov final prediction was a hung parliament with 302 Conservative seats.)
Update: below is a summary chart of final forecasting entity predictions:
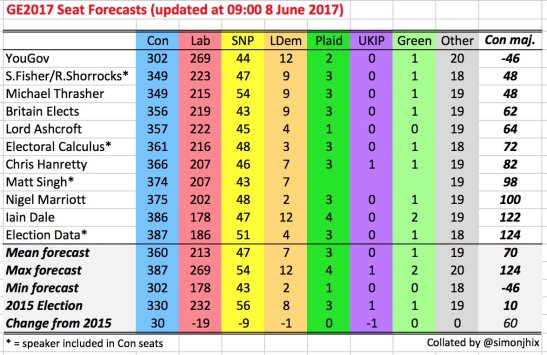
(Graphic: Simon Hix, Political Science Professor at London School of Economic, posted to Twitter)
UK election previews – Post #1 of 6
Post#2: Who’s going to show up?
Post#3: The battleground regions in today’s elections
Post#4: Far from equal: most British have little say over government
Post#5: Tactical voting costs British voters choice – but will it work?
Post#6: Who gets represented in British Parliaments?
