US elections: drivers of increased turnout
Of the many factors that will determine the coming US elections, voter turnout could prove among the most crucial in several key states.
Many media outlets are reporting – amid the tightening and contradictory poll results – that the 2016 elections will depend heavily on turnout. Certainly the two main campaigns for the Democratic and Republican parties are being unusually negative about their opposing candidates – behaviour which is thought to drive turnout down.
Some Trump campaign officials have even openly confirmed that they are engaging in a turnout suppression strategy.
Most of the US states now allow early voting, which has been underway for several days now.
Fifteen of the 50 states actually report daily early voting numbers, in some cases even giving aggregate statistics against voters’ status as registered Democrat or Republican supporters. The US Elections Project, a data and political analysis site run by Professor Michael McDonald at the University of Florida (formerly at George Mason University) is tracking these stats on a daily basis.
The news is apparently that early voting is up on 2012 numbers in the majority of these states, with some states already exceeding their 2012 totals with several days still to go. (Changes to the ease of accessing such voting opportunities provided under state laws may explain much of this increase, of course.)
Over 31 million Americans – around a quarter of all those expected to vote – have in fact already voted (as at 2 November).
Some of this data can also be examined by demographic information, and as a result some media reports indicate that early voting numbers for younger voters and African American voters are down in four years ago. This will be taken as a negative factor for Hillary Clinton, but more realistically it may indicate that these numbers were historically high in 2012 because Barack Obama was a candidate.
However increases in early voting numbers may not end up being the same as increases overall. They could simply indicate increasing numbers of voters switching from election day to early voting as a household choice of when they get their voting done.
Because the United States has voluntary voter registration and voluntary voting, rates of election turnout have always varied considerably among the states. The map below gives an indication of recent turnout rates, averaging the last two presidential elections (2008 and 2012) based on the proportion of the vote-eligible population who cast a formal vote.
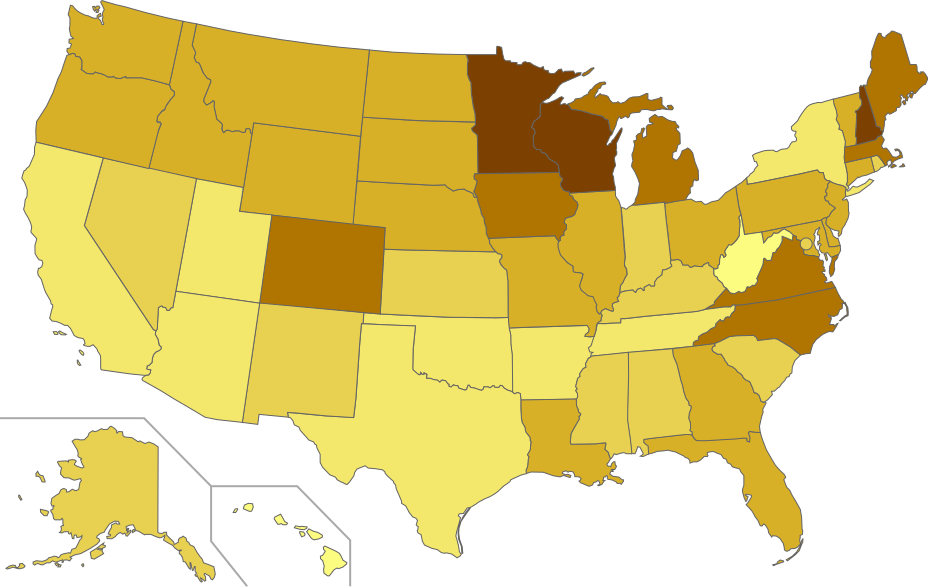
Shading indicates 5% bands of average voter turnouts by state ranging from 45%-50% (the lightest shade, for Hawaii and West Virginia) up to 70%-75% (the darkest, for Minnesota, Wisconsin and New Hampshire), using formal votes for President as a proportion of VEP (vote-eligible population) in 2008 and 2012
A slightly different map could be generated for rates of turnout against numbers of registered voters, but since rates of registration themselves vary considerably across the states, the above map is a better indication of the full rate of political participation by eligible US citizens. (Many states also have high rates of disallowing voting rights to citizens on the basis of past criminal convictions, which complicates matters even further).
Minnesota, Wisconsin and New Hampshire (the three darkest brown states in the map above) pride themselves on high rates of election participation. By contrast the largest three states of California, Texas and New York – all of which are considered ‘safe’ states for their dominant political parties – show among the lowest rates of turnout.
In the last presidential election year (2012) VEP voter turnout ranged from 43% in Alaska and 44% in Hawaii up to 73% in Wisconsin and 76% in Minnesota. The national average was 57%.
Turnout results are partly influenced by the effort that campaigning candidates put into arousing it, and by whether close contests are happening.
It’s also important to note that all the relevant US elections at state and federal level are held on the same day, so other elections happening this year such as a race for state governor or a highly competitive seat in the Senate can also act as turnout drivers.
The map below gives an impression of which states have strong additional turnout driving factors in 2016, including being a contestable state in the contest for the presidency, having a race for state governor (especially if a close contest), and having a vacant Senate seat to fill (again, especially if a close contest).

An estimate of the possible combined impact on election turnout of close presidential contests, races for senator and races for governor in 2016; darker colour suggests stronger drivers of increased turnout
As the chart shows, the drivers of turnout for 2016 are focused on half a dozen key states, with another dozen having milder turnout-driving forces this year.
North Carolina in particular has virtually everything going for it in terms of a high turnout this year.
And overall, a record turnout result might well be expected in New Hampshire, which usually tussles with Minnesota for the boast of the highest turnout state.
If – as most analysts believe – high turnout favours Democrats, then these factors bode well for Hillary Clinton.
