Australians rush to enrol, but not all are equal
Nearly 15.7 million Australians are enrolled to vote at the July 2 federal election, according to the final official tally after enrolment closed on 23 May.
The voters’ names make up the certified lists used to conduct the elections in the 150 federal House of Representatives divisions.
The elections for the senators in each state and territory use aggregates of the same lists.
At the last federal election in 2013 there were 14.7 million enrolled voters.
According to Commission’s data – which is released monthly – 169,000 people were added to the roll in the final three weeks before the closing date.
Western Australians and voters in the two territories were especially vigorous late enrolees, their numbers jumping by over 1.5% in a few weeks – probably because voters in these three jurisdictions have not had a state or territory election since before 2013.
At the end of April enrolment was estimated to be 94.1% of eligible voters. With the late enrolment surge, the Commission has probably reached its official goal of ensuring that at least 95% of eligible Australians are on the electoral roll.
Australia is one of the few nations with almost complete electoral enrolment, based mainly on a compulsory system for voters to enrol and update their details. (In the two largest states of New South Wales and Victoria, changes in the national data on enrolment and address details are supported by data flows from official sources such as driver licensing and some public utility billing databases.)
The underlying design of Australia’s electoral system means, however, that not all votes are equal in value.
Both the House of Representatives and the Senate use systems which give voters different influence depending on where they reside.
The Australian Senate is dramatically malapportioned by the effect of the nation’s state boundaries, due to the constitutional provision that the same number of senators are elected for each state. Of elected world national houses of parliament, only the United States Senate is more seriously unequal in the degree of voter influence used to elect its members.
The Senate situation was accepted as a federation compromise. This post will focus on the less-examined degree of inequality facing Australian voters in electing their representatives to the lower house, the House of Representatives.
The newly released statistics show that the 150 House divisions have enrolment totals averaging 104,511 voters. But the differences in divisional enrolment totals mean that even before taking account of the marginality of the political contest in each seat, some voters have greater influence than others.
The Electoral Commission revises the division boundaries within each state and territory at least every seven years, and in practice it does so more frequently whenever the number of House members for a state or territory needs to be changed.
The boundaries are designed to ensure that the total numbers of voters enrolled in each division work out as close as possible to a state average. But the redistribution rules only apply within each state; the Commission cannot take account of the national average enrolment numbers.
If a division has more than 104,511 voters for the 2016 elections, the relative influence of each of its voters will be less than the national average. The more voters in the division, the worse the effect.
Conversely, it is a good thing to live in a division with fewer voters, because the vote of every voter there is worth more than the average.
Victoria – last redistributed prior to the 2010 federal elections – is currently showing the most diverse pattern of relative voter influence.
In metropolitan Melbourne a tight cluster of eastern suburbs electoral divisions have unusually low enrolment totals, and therefore relatively high vote influence.
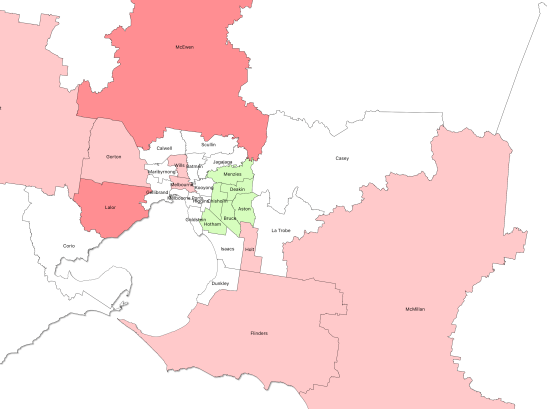
Relative electoral influence in Melbourne electoral divisions; divisions shaded green have above-average influence; those in pink shades have below-average influence; darker shades mean a greater effect; divisions in white are within 5% of the mean degree of influence
The divisions of Menzies, Deakin, Aston, Chisholm, Bruce and Hotham have enrolment totals between 96,000 and 100,000, compared to the national average of 104,511.
Those voters fortunate enough to be enrolled in Aston – broadly covering the eastern suburbs municipality of Knox – in effect will have their House ballots stamped “worth 1.09 votes” compared to the ballots of other Australians.
That difference may seem marginal, but some other Australians must pay for the Aston advantage. Voters in the division of Lalor across in the west of the city have votes worth 0.85 of the national average, and those in McEwen to the north of Melbourne are worth only 0.80.
The allocation of influence is not deliberate, or partisan. The Commission can only draw the boundaries on the basis of known ABS data and predicted urban growth rates. Once the boundaries are drawn as best they can be, the actual changes in enrolment rates are outside anyone’s control.
The six advantaged divisions in the Melbourne eastern suburbs appear to be clustered, but they are not politically uniform. They are broadly understood to be three safe coalition seats and three safe Labor ones.
The real driver is the predictability of the rates in residential growth. Eastern Melbourne – both its Liberal and Labor-voting zones – has settled, relatively slow-changing rates of population growth.
The hardest areas to predict population change are outer metropolitan areas – such as those covered by the divisions of Lalor and McEwen across town.
Following the last review of boundaries, even by 2013 Lalor and McEwen were Victoria’s two largest divisions in terms of enrolments, with 107,000 and 111,000 voters respectively.
Lalor and McEwen’s voter populations have continued to grow at dramatic rates and now have 123,000 and 130,000 enrolled voters – easily the largest enrolments in Australia in 2016, except for those in Canberra (which will get a mention below).
Some western regional areas in Victoria also have relative vote advantage, as the full state map shows.
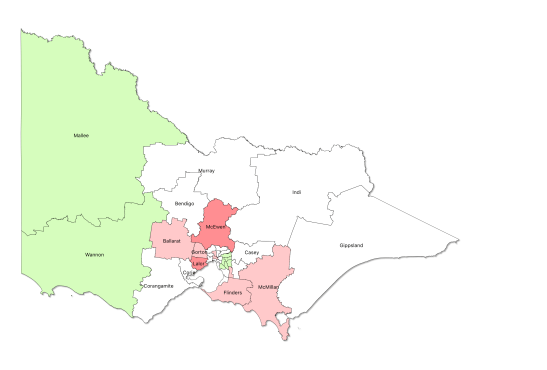
Victoria is due for a full boundary redistribution in 2017, even if the state’s number of House members does not change. That review will help equalise the state’s divisions, but it will still struggle to deal with the ever-present problem of uneven (and hard-to-predict) growth rates.
Queensland, by contrast, has seen a boundary review almost every electoral cycle for a decade and a half, because it keeps gaining additional members in the national allocation of House seats (although for the 2016 elections there has been no new seat and no boundary review).
Queensland voters currently enjoy a generally favourable rate of influence compared to the national average.
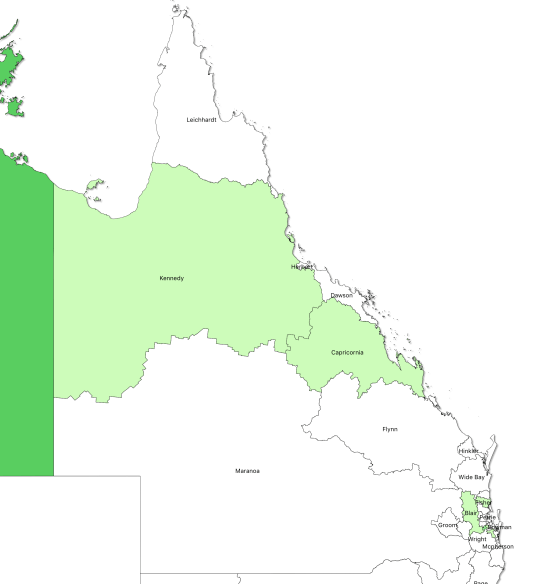
Queensland: as with the Victorian map above, green represents advantaged districts compared to the national average
Queensland has seven electoral divisions with below 100,000 enrolled voters – Kennedy and Capricornia in the north, and five divisions in a band around the outer perimeter of Brisbane.
Voters in the south-west Brisbane division of Oxley – previously held by Labor Party leader Bill Hayden and later by One Nation founder Pauline Hanson – will this election have votes ‘worth’ 1.10 of the national average.
The other Queensland divisions are all within plus or minus 5% of the 104,511-voter average.
New South Wales is in a difficult position. With boundaries fully reviewed in 2015, the Commission did a good job allocating divisions in and near Sydney. But a band of low-influence voters sweeps across the state from one corner to another.

While many of the disadvantaged voters make up the heartland of the National Party, as in Victoria the outcome pays little regard to political circumstances. Labor-favoring areas such as Wollongong and Newcastle are also disadvantaged. NSW is a state that is difficult to divide up successfully while having regard to the great variety of differing regional interests involved.
While Queensland shows a pattern of relative advantage, for the 2016 election NSW shows nothing but relative disadvantage. NSW has no divisions at all with greater than 5% of the national average influence. All of its divisions are at best within 5% above the national average (that is, divisions shown in white on the maps used here), while many are demonstrably disadvantaged.
This election, voters in the north-east divisions of Page and Cowper will have votes worth 88-89% of the national average.
In theory the Electoral Commission – which conducts the boundary reviews through a very fair and independent process – should be able to stop this happening. Australia has one of the best and most independent boundary review systems in the world. But the reality is that substantial influence variations are not being prevented.
Continuing across the nation, the voters in South Australia will have only modest variations from the average national influence at the 2016 elections. Three divisions in the west and north of Adelaide have a fairly slight degree of disadvantage.

But in Western Australia – where a recent boundary review saw a new seat created in the growth areas to the south-east of Perth – virtually all the voters are advantaged. WA electoral divisions have enrolments ranging from 94,000 to 104,000, with all the 16 state divisions being below the national average.
Voters in two WA seats – Hasluck and Tangney – have relative influence greater than 1.10 of the national average. All other WA voters are above the national average, and most are greater than 1.05.
[So … where’s the WA map? Experiencing a slight problem with the GIS files from the Electoral Commission, hopefully soon rectified. In brief, WA’s map is very green. – Ed.]
But for real relative voting advantage the voters in Tasmania and the Northern Territory win hands down.


Tasmanian voters benefit from the constitutional guarantee that every state has at least five House members; its present population would yield around 3.5 seats. So the five long-established Tasmanian electoral divisions have between 72,000 and 76,000 voters, or a relative influence of between 1.36 and 1.44 of the national average.
In the Northern Territory the advantage is even greater, with the Darwin division of Solomon having 1.49 and the outback division of Lingiari having 1.66 of the mean national influence.
The NT benefits from the specific statutory allocation of a second division but mathematically it qualifies for it anyway, as it is entitled to about 1.6 seats on population.
But the NT also has the nation’s lowest enrolment rates – significantly among its population of indigenous citizens. The rate of actual voting among enrolled people is also the lowest in the nation.
Together these factors mean that those Territorians who do enrol and do also vote are represented by two members of Parliament, where representation that was equivalent to other Australians would mean just one federal member.
Since all these national results are relative, someone has to come last. Voters in the Australian Capital Territory have just two electoral divisions with current enrolments of 138,000 and 143,000 – easily the largest in the nation.
Canberra voters are vigorous enrolees. In March the Electoral Commission estimated that 281,700 people were eligible to enrol, and the enrolment rate was over 98%, compared to the national rate of 94%
With a strong late surge of new ACT enrolments, the final enrolment tally on May 23 was 282,126 people. Even allowing for several hundred people turning 18 or otherwise becoming eligible in the past 7 weeks, this seems to be an enrolment rate of around 99.9% of those eligible – figures that might be worth looking into.
But in any case, Canberra voters are a seriously disadvantaged lot, with relative influence of around 0.74 of the national average
Voters enrolled in the division actually named Canberra – the southern half of the city – are Australia’s least influential citizens in electing representation to the House, despite the irony that the Parliament is physically located there.
The current electoral law has left the ACT people just shy of the numbers needed to qualify for a third House seat for many years. The territory population is growing strongly, but not quite strongly enough.
Needless to say if a third seat is one day allocated to the ACT’s voters, they will suddenly join the Tasmanian people as seriously over-advantaged. The oddities generated by the calculations for representing voters in the two Australian territories only serves to highlight the mathematical problems generated by the current approach to House representation.
Using single-member divisions, and allocating seats with fractions of quotas – and on the basis of changing populations in regions and urban areas which are difficult to divide by sensible boundaries – makes such inequalities mathematically inevitable. They will remain inevitable for so long as single-member electoral divisions are used.
This post has not discussed the much greater significance on election outcomes that is caused by the different political marginality of the House’s single-member seats. But it has at least shown that the assumption that all Australian voters are equal is actually significantly mistaken.
__
This post, and in particular the maps used, incorporates data that is © Commonwealth of Australia (Australian Electoral Commission) 2016, and available at the Commission’s spacial data page.
