
US election: tracking who is winning
As the world anxiously watches the race for the United States presidency, a variety of opinion-tracking services are desperately trying to predict who is winning.
The third presidential debate takes place today in Las Vegas against the background that all current polling indicates that Republican Donald Trump is badly trailing his Democratic rival Hillary Clinton.
But the American electorate is volatile, with populist anger against the modern conduct of politics and government running deep among supporters of both political parties and among independent voters. And the Clinton campaign is certainly not immune to last minute negative developments.
The Trump campaign appears to have turned its tactics towards a ‘low-turnout’ strategy, recognising that if its own supporters are turning away from their party’s candidate, the only option is for a vicious campaign which aims to drive potential Democratic voters to stay home as well.
A nervous and divided nation – and a fascinated wider world – looks for news of which campaign is winning. Never have so many polls, including polls in so many contested states, flooded the public domain.
Traditional polling services have in recent years been boosted by several innovations, including poll aggregation, prediction markets, and probability estimators.
Poll aggregators
In recent years the science of polling has been enhanced with the growth of poll aggregator services, which combine and average a variety of polls, smoothing out their differences and detectable variations, amassing larger polling samples in total, and taking account of any differences in demographics behind the multiple poll samples.
The longest established poll aggregator service is hosted by Real Clear Politics. It includes aggregation of both two-way Clinton-vs-Trump polling, as well as four-way polls including the two minor presidential candidates, the Libertarian Party’s Governor Gary Johnson and the Green Party’s Dr Jill Stein.
The following snapshot indicates that (as at October 19) the current ‘RCP Average’ was a lead of ‘Clinton +6.2‘, that is, Clinton specifically leading Trump (without regard to how the minor candidates are polling) by 6.2%.

The Real Clear Politics poll aggregate (snapshot from Oct 19)
Just below its up-to-date table of recent polls, Real Clear Politics also presents a matching tracking graph over time:
![]()
RCP’s tracking graph (also Oct 19) hows that Clinton has led noticeably all year, other than a brief lead by Trump in the week of the Republican Convention in July
Note that the US elections are all based on plurality voting. The votes cast for Johnson and Stein play no counting role in determining the winner in each state (other than that their very existence has deprived the leading candidates of potential votes).
Other established poll aggregators are those at Nate Silver’s FiveThirtyEight, the Huffington Post, the Princeton Election Consortium, Talking Points Memo and ElectoralVote.
All the aggregators have consistently indicated that Clinton held a national lead at almost every point in the campaign.
Publicity from the Republican party convention in August produced for Trump a brief poll boost that brought him in touch with Clinton, or even slightly ahead. But just a week later public reaction to the matching Democratic party convention sent Clinton surging to a lead that she has kept ever since.
All poll aggregators have been similar, showing Clinton’s surging lead from late July through August, easing off to a narrower lead during September, and then surging again when the Trump campaign’s wheels began coming off in late September.
Prediction markets
An alternative prediction analysis service is the ‘prediction market’ run by the University of Iowa, known as the Iowa Electronic Market (IEM).
Operating since the year 2000, the IEM approach generates statistics on fluctuating ‘prices’ for participant predictions using $1.00 unit stakes of real investment by the thousands of participating individuals.
Using this mechanism, unit prices vary between zero and $1.00, with the latter meaning that investors are so certain of a result that contract units for the alternative simply cannot be sold.
IEM sells contracts for a variety of political contests, but the most important IEM product is for the party (not the specific candidate) which becomes the ‘winner-take-all’ winner of the presidency in 2016, shown below.
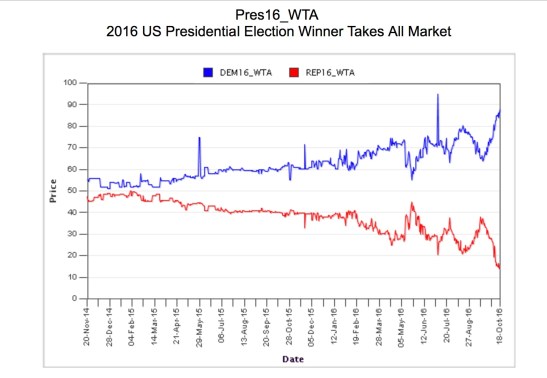
IEM’s prediction price graph for the party winning the US presidency over the past 18 months.
Like the polls and their aggregations, IEM has consistently shown the Democratic Party as the probably winner, with its price levels actually showing the lead more starkly than the poll curves.
At no point has the investment price of a Republican president led that of a Democratic one. Except for the brief surge effects of the party conventions in August, Clinton’s price has not fallen below around $0.60, nor has Trump’s risen above around $0.40, from the period in around February 2016 at which the two candidates became the leading candidates for their respective party nominations.
Indeed, the price floors and ceilings have been remarkably stable since around July 2015, when both campaigns were in motion.
In the last decade IEM developed a solid track record for out-predicting the polls, and attracted a lot of scientific discussion. In recent years attention on IEM has been eclipsed by the growth of more advanced probability estimation services.
Probability estimation
One of the most highly regarded poll aggregators is Nate Silver’s FiveThirtyEight.com service, mentioned above. In recent years this site led the development of estimation methods to derive the specific probability of candidates winning elections.
The method is not based only on the national poll leads, but uses separate polling aggregations in each one of the 50 states. A win probability is calculated for each state, and all 50 probabilities are then aggregated to generate a single overall probability of winning the election.
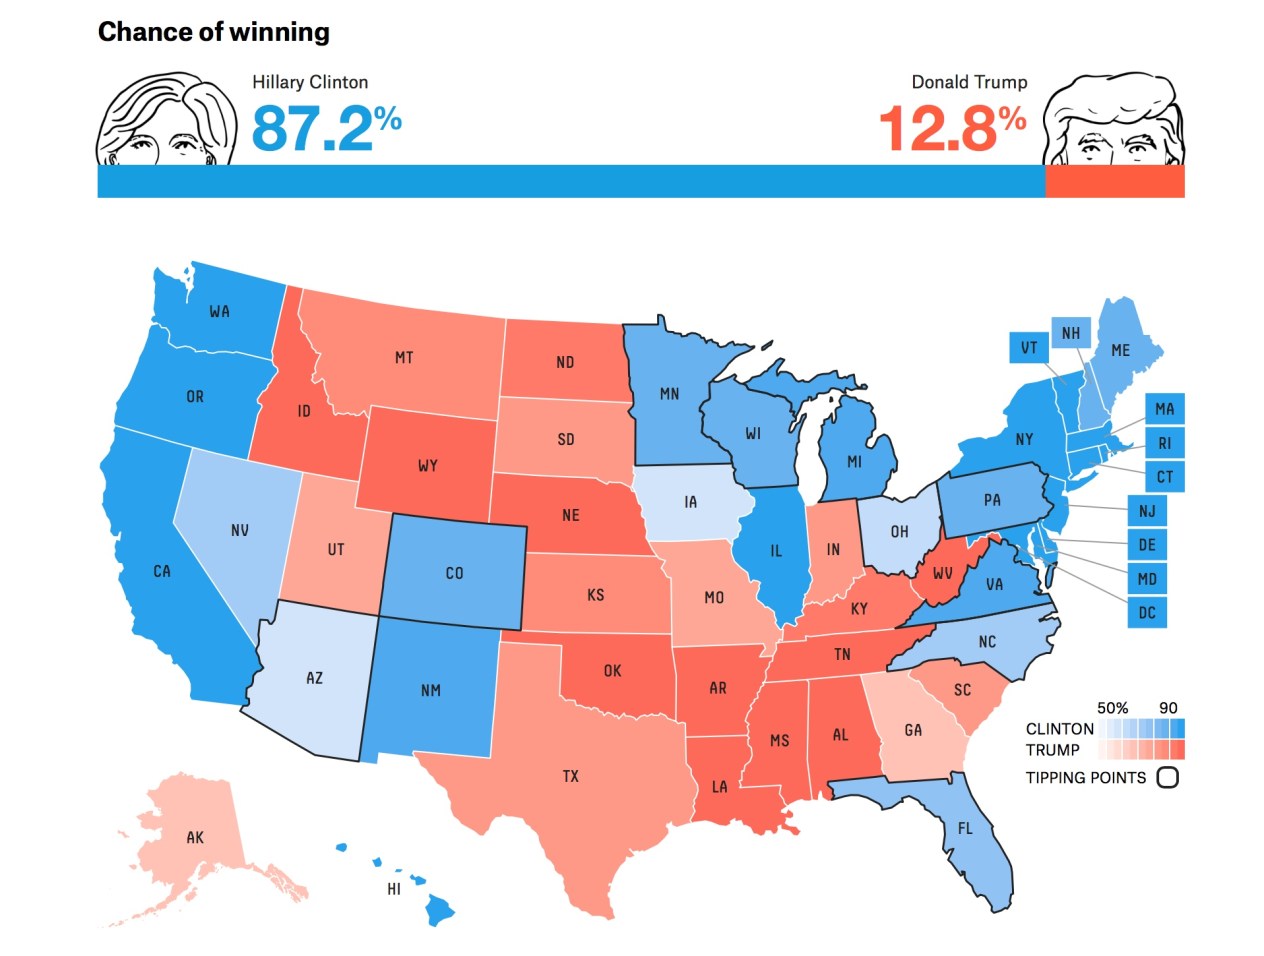
FiveThreeEight.com’s result prediction map (as at Oct 19)
Other probability estimation services are to be found at the New York Times‘ Upshot page, Daily Kos, the Huffington Post, and leading political analysts David Rothschild’s PredictWise service.
So who is winning?
The upshot of all three approaches to prediction is strikingly consistent: the Clinton Democratic campaign has clearly led the Trump Republican one at every stage of the race other than – by some measures – a brief single week of alignment following the publicity of the Republican party convention in July.
With less than three weeks to go, Trump’s campaign is in serious trouble.
Hillary Clinton is winning in more than enough states to win the presidency. In fact the FiveThirtyEight map above shows that – for the moment – even the safe Republican state of Arizona is now more likely to elect a Democratic Electoral College list than a Republican one. Other States such as Missouri, Alaska and Georgia are shifting from ‘dark red’ to ‘light red’ in their probabilities.
There is even wild talk that the race is close in the Republican’s largest and most vital state, Texas.
The Republicans, on all this data, are facing a serious loss in 2016.

Katie bet me that Missouri would go Clinton. Not that I’ve seen yet. Thoughts? Reg
Reg: Well is depends on the odds offered, doesn’t it, but Kate is a skilful gambler!
No polling or probability site I have seen has said that Missouri is more than 50% for Clinton, but it is certainly close.
But the states where a late crash for Trump’s vote – based on his campaign negatives of the past few weeks – are more likely to be those with higher tertiary educated, non-white and possibly evangelical (many are aghast at trump). Missouri only partially fits that bill.
Certainly, however, Missouri is one to watch for shifting sentiment. But note that if Missouri votes for Clinton, it will not be as part of a close election, but as part of a landslide for Clinton.