Australian Government’s uneasy club of marginal House backbenchers
As if the Turnbull government’s upcoming troubles with the newly elected Australian Senate were not enough to worry about, their own House of Representatives backbench will present even more anxieties to deal with.
There will be a highly unusual total of 14 government members elected on margins of less than 2%.
The situation for the current government is in some ways worse that that faced the 43rd Parliament elected in 2010, where the Labor government managed to govern for three years with only 72 of the House’ 150 seats.
Comparing the fragility of marginal seat sets is a little difficult. The following analysis compares the ‘middle 50’ of the 150 House sets for each of the past three election results. That is, it leaves the 50 safest Labor and the 50 safest Coalition seats to one side and compares the middle ground.
Let’s start with the 2013 election result: a fairly standard result, presenting quite a safe governing majority.
The chart below shows the ‘middle 50’ House seats after the 2013 election, with the Liberal-National coalition government’s seats appearing from the left of the graphic, in descending order of their marginality.

In the chart the balance point – the 76th seat which assures a government of a majority – happens to be the division of Robertson, shown in black.
All but one of the government seats is held by the Liberal (or Queensland Liberal-National) party, with the seat of Page (shown in turquoise) the sole National party marginal seat in the middle 50.
The non-government marginal seats begin emerging on the right of the chart, shown in grey. Included among these seats is the seat of Indi, won for the first time by independent Cathy McGowan by a narrow margin. (If the seat had not fallen to an independent it would not appear here, as it would have been a very safe coalition seat.)
The election of the coalition government in 2013 was a fairly safe result. The equivalent charts for most elections would look somewhat like the 2013 chart, with a greater or smaller degree of government domination.
But the 2010 election result – by some measures the closest of Australia’s 45 national elections – looks quite different:
The Gillard Labor government’s collection of narrowly held marginal seats actually peters out three seats to the left of ‘seat 76′, which is shown here as the division of Brisbane.
For the following three years Labor held on to office with the support of four other House members, only one of which happens to appear on the chart above (the member for the seat of Denison, Andrew Wilkie).
The other three 2010-13 government-supporting cross-bench members held their seats by margins among the safer 50 seats graphically to the right of those shown above. (As it happens the seat of Melbourne – held by the Greens’ Adam Bandt – was only just out of sight to the right of the last seat shown, Stirling.)
(Readers should note that while most own these results are identical to the ‘two-party-preferred’ measure, electoral divisions where a non-major party candidate won are treated specially, based on their own margin of safety. The exception to this approach is National-vs-Liberal contests, whose results for the purpose of these graphics are based on the Electoral Commission’s special 2PP counts. These latter cases are all very safe seats and so don’t appear on any of these ‘middle 50’ charts).
The 2010 election had a government backbench whose fate was decided by the government’s overall performance, not their own margin concerns, making the backbench actually more disciplined. As a result the ongoing strategy of the government was not directed towards what its marginal seat holders thought to the normal degree.
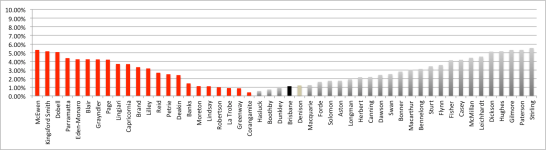
Which brings us to the recent 2016 election. Counting has not yet been completed, so the equivalent chart below has been generated from Commission results as at July 14:

The ’76th seat’ – in this case the division of Capricornia – is once again marked in black. On the latest counting results the coalition is just slightly in front in a 77th seat – Herbert, barely visible on the above chart.
While the result for the government after this election seems at first glance to be a better position than that facing Labor in 2010, there is one noticeable phenomenon about the latest government backbench: an unusually flat curve of very close marginal wins.
As many as 14 seats held by the new government will have been won on less than 2% margins. The equivalent for the 2013 coalition win was 10 seats below, and for Labor in 2010 is was just 7 seats.
Visible on the right of the 2016 chart, the curve of the non-government marginal wins rises more quickly, with just 7 seats below 2%.
All this will make for an especially nervous House government backbench in the coming term. Governments will generally worry about any seat won by less than 5%, let alone those on less than 2%.
The historically large club of 14 anxious ‘sub-2%’ government members will consist of 13 backbenchers – Ewan Jones, Michelle Landry, Bert van Manen, Ann Sudmalis, Ken O’Dowd, Lucy Wicks, Julia Banks, Jason Wood, Chris Crewther, David Coleman, Luke Howarth, Rowan Ramsey and Ken Wyatt – as well as Immigration Minister Peter Dutton.
These members will no doubt press the government for special attention to their electoral divisions, adding to the government’s current Rubik’s Cube of challenges.
This will add to the worrying mathematical fact that just one by-election seat changing hands, one mid-term defection to the cross-bench or even just a single defection on a specific vote can bring the government’s control of the chamber into doubt.
In some ways, Prime Minister Malcolm Turnbull might have been better able to govern with 74-75 seats than with 76-77, given the accomodating level of support being shown by at least two of the independent house members.
The government’ term and political strategy will need to be developed around the task of protecting its large number of at-risk seats. All the more so if an early election should become politically necessary.
Overall the government’s 20 most marginal seats turn out to be from fairly concentrated parts of Australia.
The broadest area of risk is the whole state of Queensland, home to no less than eight marginal seats (two of the non-government marginals are also in Queensland). Across Queensland the government will be under massive pressure to fight off the newly-reborn One Nation party.
A cluster of four government marginal seats in south-east Melbourne – Casey, Chisholm, La Trobe and Dunkley – will also need to receive attention.
Three government marginals – Hasluck, Pearce and Swan – are in the Perth area (as are two non-government marginals – Perth and Cowan).
Two government marginal seats – Banks and Reid – as well as one non-government marginal in Lindsay – are in the western suburbs of Sydney.
The government will also need to pay much attention to South Australia, where the NeXt party founded by senator Nick Xenophon won the seat of Mayo, came a well-run second in Grey and Barker, and was a general state-wide threat.
Finally, the north coast of New South Wales is suddenly back in strategists’ thoughts with the National party holding Page, Cowper and New England by historically very low margins.
Page has been a generally marginal division for several elections. If former independent member Tony Windsor has run his last campaign the division of New England may fall off the radar, but independent Rob Oakeshott abruptly made Cowper competitive last month and it may remain so if he continues to menace the Nationals with the possibility of another attempt.
All this regional focussing highlights one of several inequalities generated by single-member division electoral structures. The two-thirds of Australians who live in places either side of the ‘middle 50’ electoral divisions can expect much less political attention in the coming term.

Appreciate thhis blog post